


Sample Seismic Analysis - Otter creek 3D
Greenwood Co., KS
Blackstar 231 Corp.
This is a seismic time analysis of the Otter Creek 3D. The following seismic section, (Figure 1, which is Inline 53 that runs N-S through the Schoenhals 1-07 well as shown as a yellow N_S line on the Mississippian Time Structure map in Figure 2.) demonstrates how well the seismic data and the horizon tops for the well information tie. A sonic LAS file (from this well) was used to create a synthetic seismogram in order to tie the well tops to the seismic data. The light green overlay curve on the left side of the line is the Gamma Ray curve from the well. The light blue overlay curve is the Density curve and the dark blue overlay curve is the sonic curve. The synthetic seismogram is the insert to the right of the sonic curve.

Figure 1, N-S inline 53 from the data set through the Schoenhals 1-07
Figure 2 is the Mississippian Time Structure map showing the N-S line in yellow through the Schoenhals 1-07 well. The time structure map indicates a structural high to the NW of the three Schoenhals wells on the section line between sections 26 and section 35. This structure would indicate that the high would be approximately 20 to 30 feet higher than the Schoenhals wells. The Schoenhals wells appear to be drilled on a nose off of this high.
Another more prominent high is developing in the NE corner of section 36, and is at least 60 to 70 feet higher than the Schoenhals wells. Because this high is right on the edge of the 3D seismic survey it would probably be prudent to extend the 3D survey in this direction, to verify the location and extent of the structure.
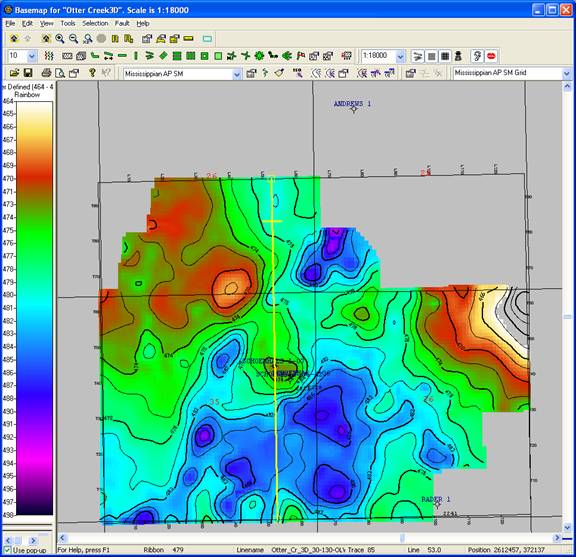
Figure 2, Mississippian Time Structure Map
A third potential location for a well would be in the NE ¼ of the SW ¼ of section 26.This high appears to be between 15 and 20 feet higher than the Schoenhals wells.
A total of eight (8) horizons were mapped for this project and include the Marmaton, Cherokee, Cattleman, Bartlesville, Mississippian, Osage, Chattanooga and the Arbuckle. The time structure maps for these horizons appear in the figures below.
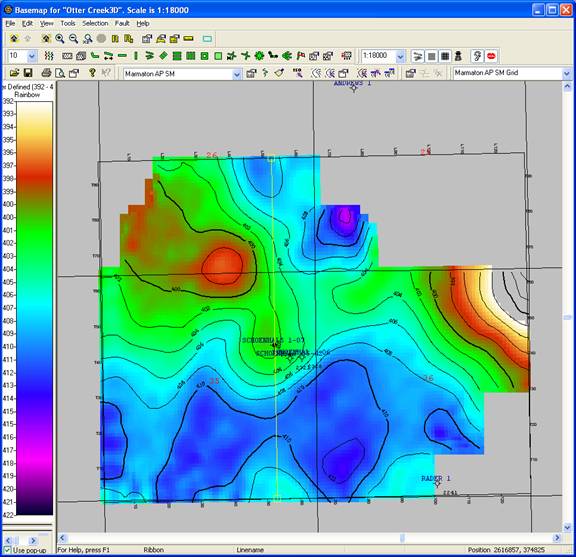
Figure 3 – Marmaton Time Structure Map
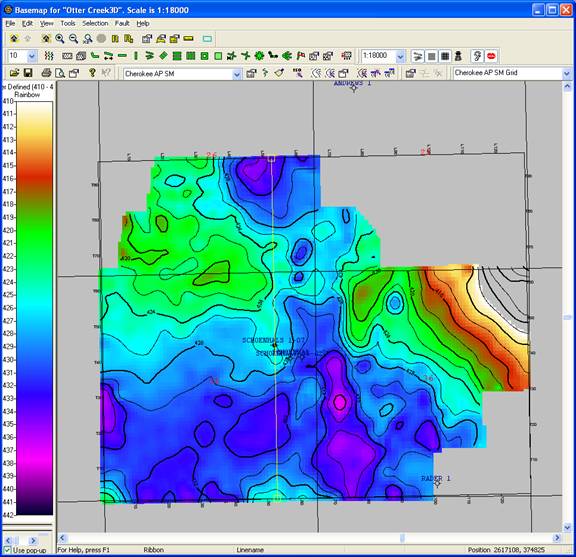
Figure 4 – Cherokee Time Structure Map

Figure 5 – Cattleman Time Structure Map
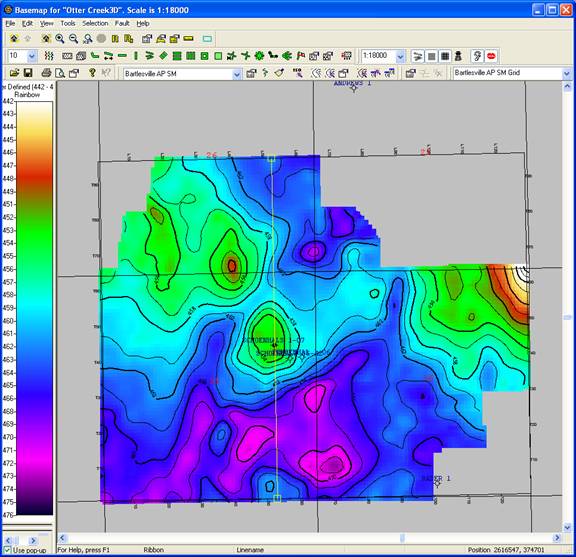
Figure 6 – Bartlesville Time Structure Map
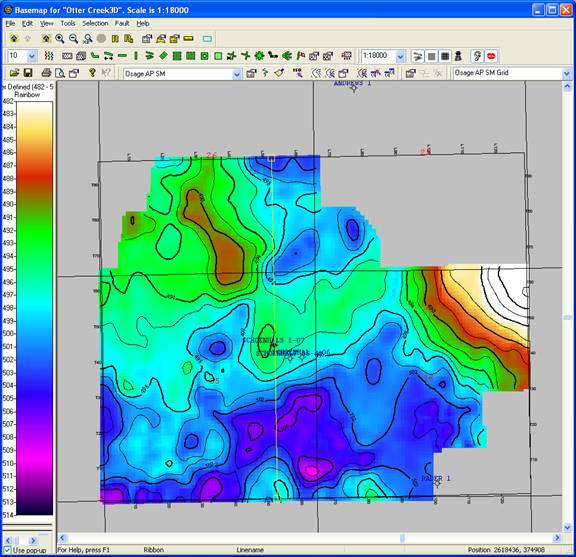
Figure 7 – Osage Time Structure Map
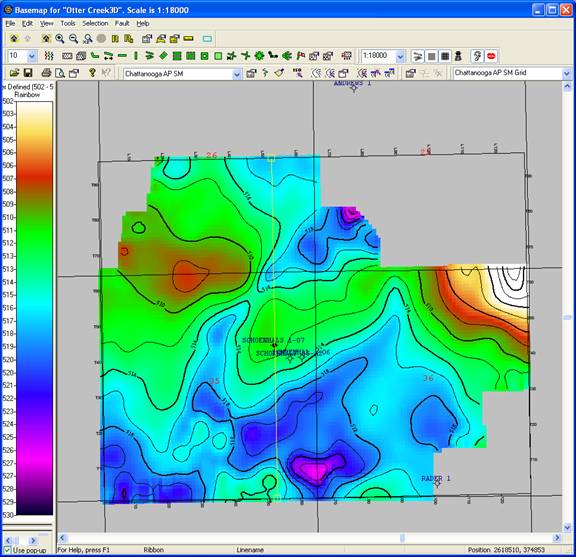
Figure 8 – Chattanooga Time Structure Map
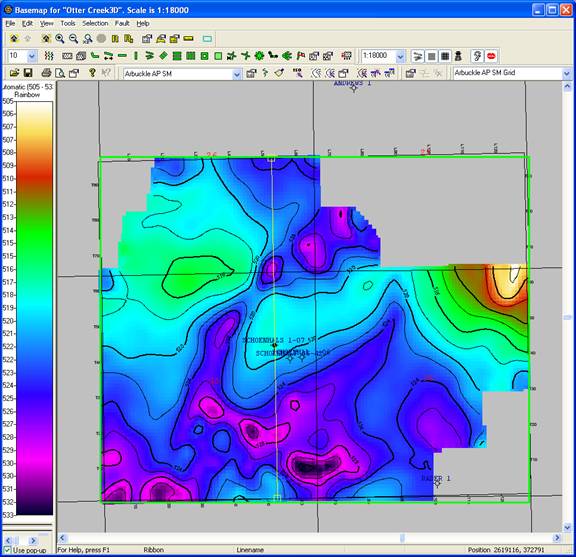
Figure 9 – Arbuckle Time Structure Map
The following isochron maps demonstrate the thinning between the Marmaton and the deeper horizons.
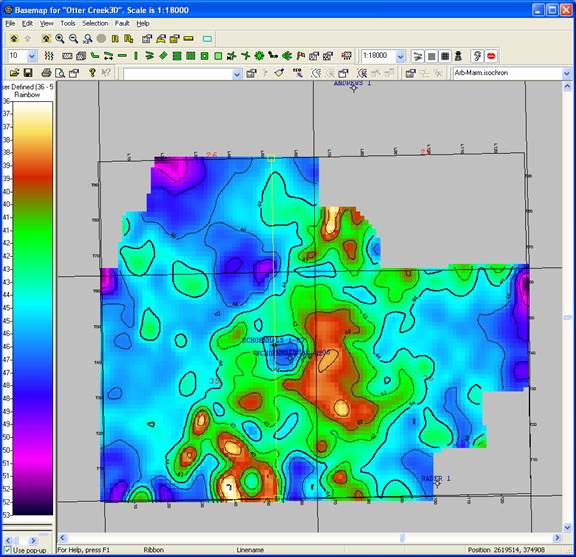
Figure 10 - Isochron: Marmaton to the Arbuckle
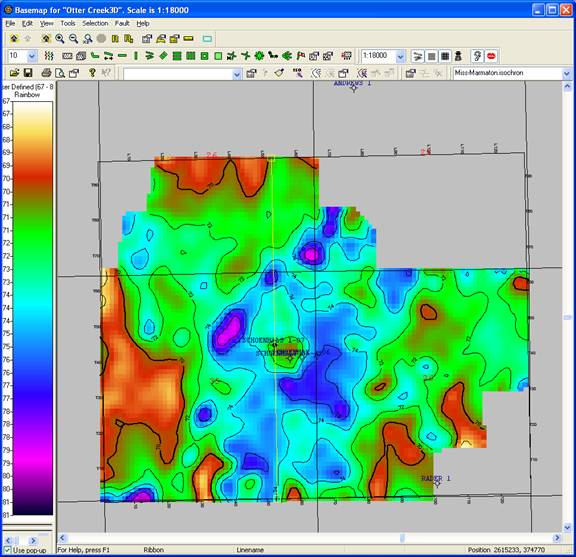
Figure 11 - Isochron: Marmaton to the Mississippian
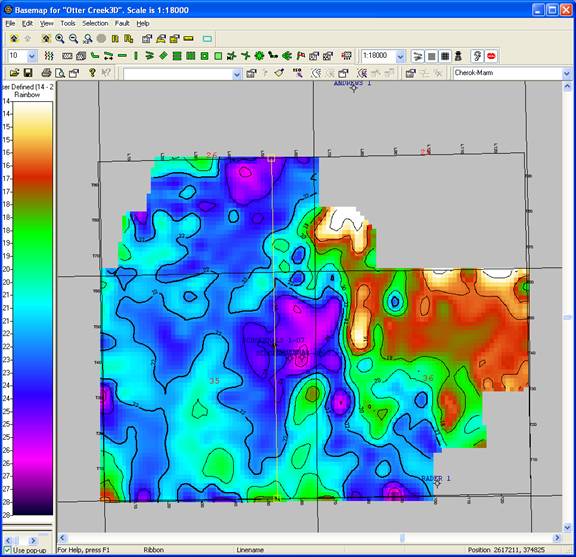
Figure 12 - Isochron: Marmaton to the Cherokee
When an arbitrary section (Figure 14) is run through the structural highs as indicated in the Mississippian time structure in figure 13 below and then is flattened on the Marmaton, it shows that the structures are still in place but maybe not with the amount of relief as indicated on the time structural maps.
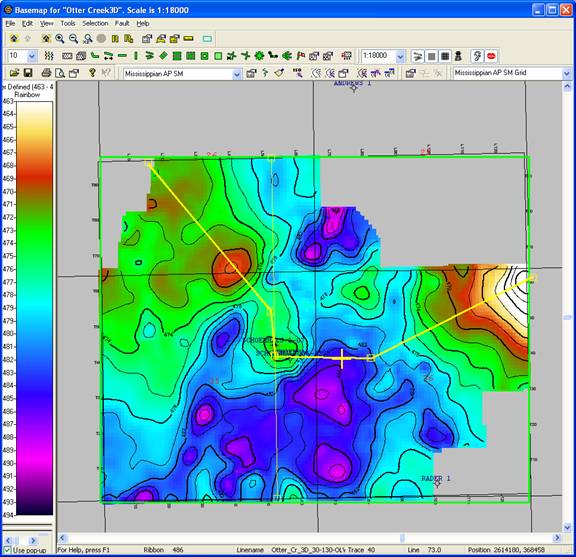
Figure 13 – Mississippian Time Structure with Arbitrary Line in Yellow
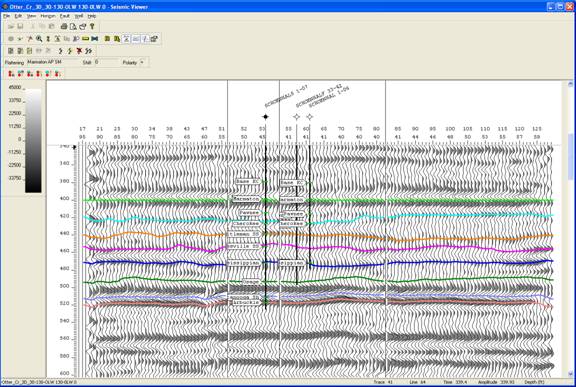
Figure 14 - Arbitrary Line flattened on Marmaton
The following isochrones exhibit what probably are channel sand deposits in the Cattleman and the Cherokee. To further prove this hypothesis, spectral decomposition will be calculated using the data interpreted to determine if there is tuning of the sand in the channels. The spectral decomposition analysis will be presented in another report.
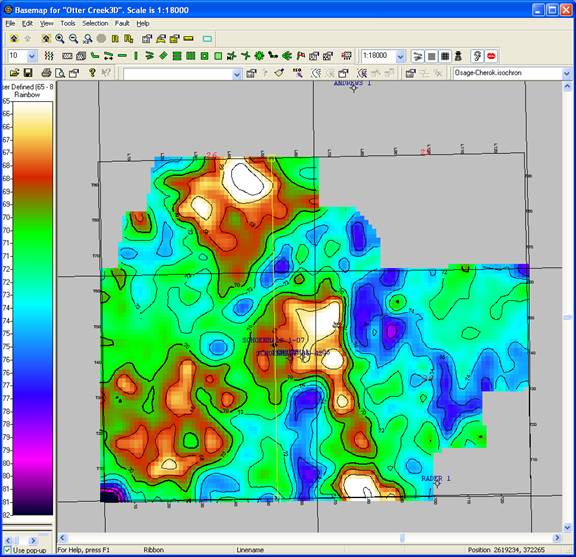
Figure 15 - Isochron: Cherokee to the Osage
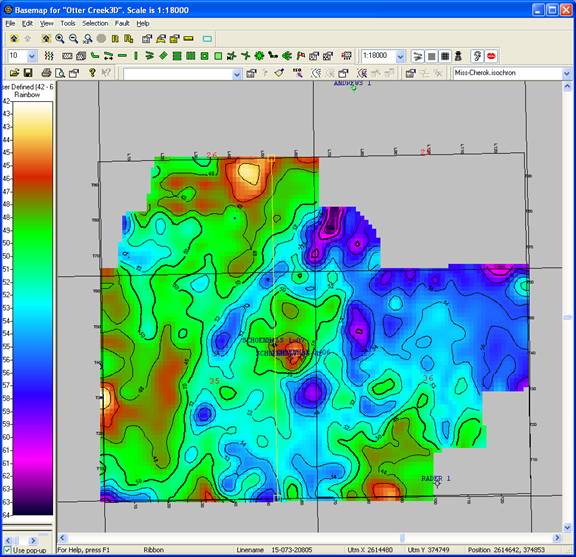
Figure 16: - Isochron: Cherokee to the Mississippian
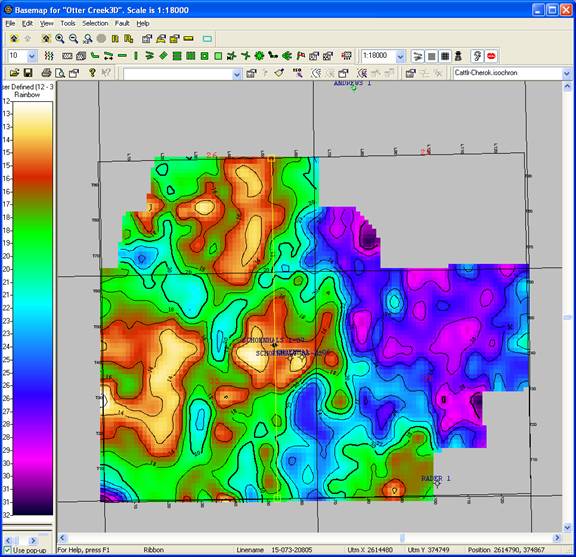
Figure 17 – Isochron: Cherokee to the Cattleman
These isochrones demonstrate the channel sands that are orientated NE-SW through the SE corner of section 26 and continuing on through the middle of section 35.
On completion of the spectral decomposition analysis, new maps will be generated with proposed well locations.